[Visual Analytics for Powerful Business Insight] i-CANVAS
i-CANVAS is a BI solution to be able to analyze and modify and share various reports on the web environment such as OLAP, static reports, dynamic charts, dashboards, statistical analysis reports. The user can make reports of various types through the components of i-CANVAS by connecting the needed data directly.
Also, i-CANVAS provides all functions from the intuitive screen compositions to the association analysis and the detail analysis to comprehensive analysis for various conditions within a single environment.
Optimized screen compositions for KPI Analysis & EIS Construction
The user can make the excellent intuitive Look & Feel to add various components by the mouse interaction only.


Interactive analysis

Standard Compliance of HTML5

Automatic creation of the Multiple Conditions window

Screen compositions of various types to the analysis purpose


If you have a question about our solution, please use the below contact information.
- Sales: sales@bimatrix.co.kr
- Marketing: mktg@bimatrix.co.kr
- Website: http://www.bimatrix.co.kr
Also, i-CANVAS provides all functions from the intuitive screen compositions to the association analysis and the detail analysis to comprehensive analysis for various conditions within a single environment.

Optimized screen compositions for KPI Analysis & EIS Construction
The user can make the excellent intuitive Look & Feel to add various components by the mouse interaction only.
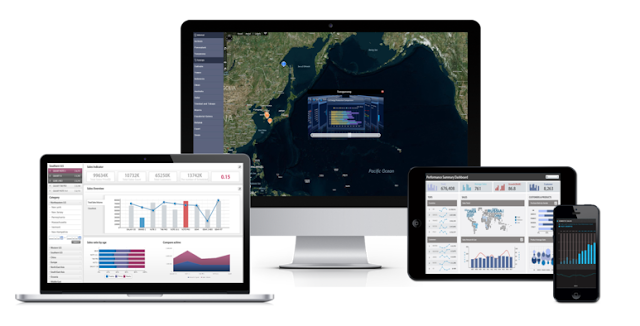
[The example of management dashboards]
Fancy and intuitive reports
- Support both the detail reports and intuitive & fancy Look & Feel
- Create Complex reports by free arrangement of various components and data grids and setting options such as charts, buttons, gauges, etc.
- Add several contents to a dashboard by the functions such as Tab, Popup, Paging, etc.
- Support the high development productivity to provide report templates, technical documents, etc.

Interactive analysis
- Charts and graphs are showed in the real time whenever the selected data is changed with the data table.
- The user can change the CRUD type to the list or the general OLAP report and can rapidly create the screen to input data by the key type of each column and setting the data type.

Standard Compliance of HTML5
- i-CANVAS supports various browsers to provide the No Plugin environment by the standard compliance of HTML5.

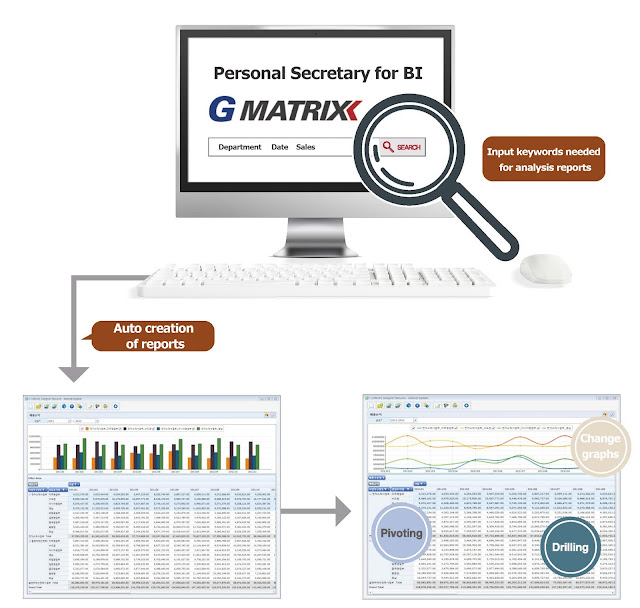
Automatic creation of the Multiple Conditions window
- The specialized development method of BI MATRIX is to implement "No Programming, No Coding".
- i-CANVAS create it to automatically control the search condition even if the user directly does not set the data sources and properties one by one.

Screen compositions of various types to the analysis purpose
- The user can analyze key performance indicators such as financial status/records/plans/forecasts to the detail information as the user definition.
- The user can make the analysis screen based on a scenario by steps: Considering KPI-oriented conditions → Detail analysis of specific indicators → Tracking and responding problem factors
- i-CANVAS provides various information to decision making by the association analysis and the detail analysis on the screen of dashboard such as charts, grids, maps.
i-CANVAS is applied to the various fields as below.
- EIS/KPI Analysis
- CRM/Marketing Analysis
- Cost/Profit Analysis
- Production/Manufacturing/Quality Analysis
- balance sheet/EVA Analysis

[Example to applied to i-CANVAS]
System Configuration & Specification

If you have a question about our solution, please use the below contact information.
- Sales: sales@bimatrix.co.kr
- Marketing: mktg@bimatrix.co.kr
- Website: http://www.bimatrix.co.kr


Comments
Post a Comment