Posts

Showing posts from May, 2017

[Auto creation of reports by searching keywords only] G-MATRIX

Image
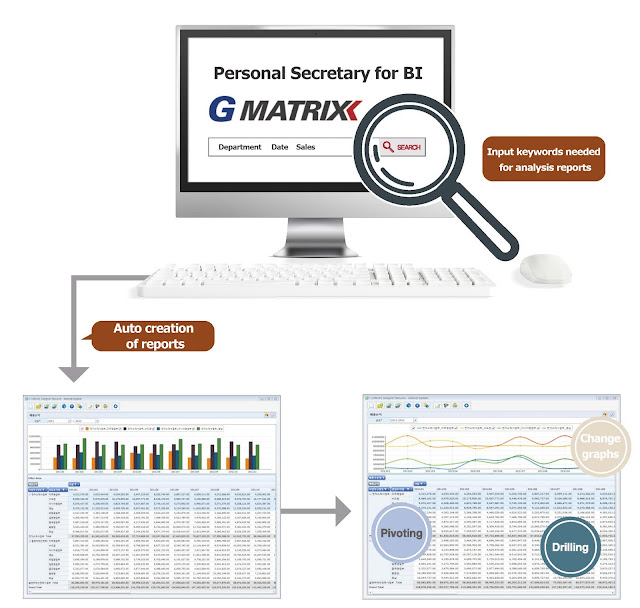
G-MATRIX is a solution which can extract needed data and create analysis reports by searching keywords only . The user can input the data name for an analysis like searching data in the portal website and can automatically create desired reports based on the search results Especially, the user can perform dynamic analyses with liking tables and charts and the personalization of analysis reports. If the user can use G-MATRIS that is a personal secretary, the user can make essential reports in the real-time.         If the user uses G-MATRIX, the user can have effects as below.      If you have a question about our solution, please use the below contact information. -  Sales:  sales@bimatrix.co.kr -  Marketing: mktg@bimatrix.co.kr -  Website: http://www.bimatrix.co.kr

[Big Data Analytics Platform] i-BIG

Image
i-BIG is a platform optimized to big data analyses for enterprises and performs big data analyses of various types more effectively in a single platform because the analysis technologies of big data converge to the BI/OLAP technologies. i-BIG provides analysis results for solving problems and performing effective management and forecasting future and finding a new business so that the user can quickly and accurately analyze various data of companies which is created at high speed and can forecast future of companies and handle it. Optimized and customized Platform to analyze big data Support both Column DB and In Memory DB considering the customer’s data environment In Memory The processing speed is improved because search results which are often used store and handle as the type of the Memory DB file in i-BIG. It also manages the user’s queries by the Memory Query Manager. Example) new information system of home shopping company The company can reduce the search proce

[Visual Analytics for Powerful Business Insight] i-CANVAS

Image
i-CANVAS is a BI solution to be able to analyze and modify and share various reports on the web environment such as OLAP, static reports, dynamic charts, dashboards, statistical analysis reports . The user can make reports of various types through the components of i-CANVAS by connecting the needed data directly. Also, i-CANVAS provides all functions from the intuitive screen compositions to the association analysis and the detail analysis to comprehensive analysis for various conditions within a single environment. Optimized screen compositions for KPI Analysis & EIS Construction The user can make the excellent intuitive Look & Feel to add various components by the mouse interaction only. [The example of management dashboards]     Fancy and intuitive reports Support both the detail reports and intuitive & fancy Look & Feel Create Complex reports by free arrangement of various components and data grids and setting options such as charts, butt

[Integrated solution for data analytics based on AI] i-STREAM

Image
i-STREAM is an integrated analysis solution supported to all processes of data analysis from the extract data to the visualization of analysis results . A data analyst can easily use i-STREAM because it performs quickly response requests for handling complex data.   <Problems of the advanced analytics process> - Analysis processes based on scripts - Difficult management and maintenance - Separate tool to use the functions of data preprocessing , data mining, modeling - Difficult big data mining i-STREAM that have been developed to solve the above problems provides to integrate the various functions such as ETL, the application of multiple data sources, data analytics, data mining, and statistics. i-STREAM can perform the data preprocessing to extract data from various data sources and save the data. Also, i-STREAM can write a workflow type to drag and drop the preprocessing node and handle it by various types. i-STREAM can perform quick analysis wo

What is cube?

Image
The cube is in the center of multidimensional Analysis. It can be database or multidimensional database. The cube is consisted of levels, measures, dimensions and hierarchies. It is a method to store data as multidimensional type. The measures are categorized by dimensions. The cube is designed by business logics because it used in OLAP is usually used to analyze the high-level analysis by business users.   < http://blogs.technet.com, Insufficient data from Andrew Fryer >    On-Line Analytical Processing (OLAP) is actually about business, it just sounds like a science project.  ​ - Hugh McLeod      *Short explatation for OLAP OLAP( Online Analytical Processing ) is a strategic method to analyze big data by multidimensional analysis. There are two types pf OLAP as below. 1) MOLAP MOLAP(multidimensional online analytical processing) indexes directly into a multidimensional database. It processes data that is already stored in a multidimensi

PR Vedio of BI MATRIX

Image
Let me introduce our PR vedio to help you understand what BI MATRIX's BI and BA solutions are.   Your company owns numerous types of data. And you use those diverse data for the everyday decision making, which can affect your business. It's also important to understand how your company is running its business based on these numerous corporate data. But more importantly it is the most essential to understand how we can make results. BI lets you know how you have been running your business. BA lets you know how to run your business in the future. BI and BA solutions of BI MATRIX help you make strategic decisions based on data, and not a corporate manager's intuition. A company's numerous data illustrates the past and the present of the business. Moreover, by describing the future, it allows you to make data-driven decisions in order to challenge barriers and to widen the business opportunities. Based on BI and BA solutions, the executives can perfo